Laptop
It has long seemed strange to me that modern operating systems do not distinguish desktop PC from laptop. But the laptop is a mobile device and its batteries are not always enough for a full working day. Of course, there are basic functions like showing the remaining battery charge in percent and calculating the remaining time until the full discharge. But it is not clear how it is calculated and whether it can be trusted. In general, I decided to write my battery monitor for Ubuntu.

As an inspiration source, I took the battery monitor on Android:
- icon with battery level in the tray, number next (charge level in percent)
- click on the icon to pop up a menu with a simplified schedule of two parts: the last few hours of operation of the device and the expected discharge time

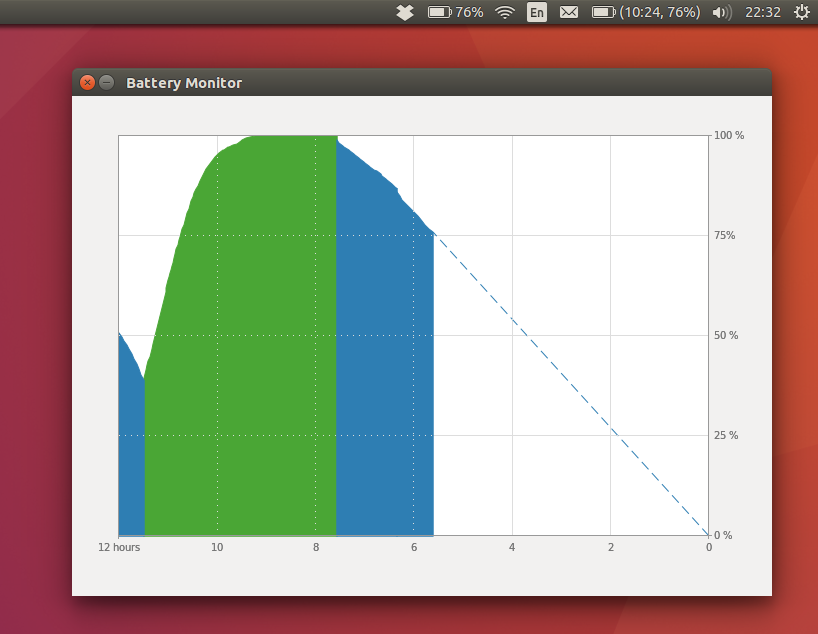
Later it turned out that embedding the picture in the drop-down menu is an impossible task for me. Therefore, I decided to display the graph in a separate window instead of the drop-down menu.
The program consists of the following parts:
- Receiving data about the battery charge and recording them in the logs
- Extracting data from logs
- Grouping of data on continuous work sessions
- Conversion of absolute time into relative device operation time
- Smoothing discrete data within a session
- Calculation of time to full charge / discharge
- Image generation
- GUI: tray icon, drop-down menu, battery status graph, color theme
I wanted to write the program with a minimum of external dependencies. Currently, only Python GI is used for the graphical interface (tray indicator, window).
The data is retrieved by reading the corresponding files from the directory / sys / class / power_supply / BAT0 / . Here you can find everything that relates to the power supply of the device: the current values of voltage and current, the remaining charge in percent, etc.
Logs are recorded every time the charge level changes, but at least every 3-5 minutes. Records at intervals more than this will be determined as periods of laptop disconnection and will not be shown on the graph. To take into account these interruptions, we need to convert the absolute time into a virtual device operating time.
Another feature of the input data is that they are discrete. The battery charge level is displayed in percentages and stored as a natural number. Therefore, steps that are 1% high are inevitable on the graph.

I tried to do the smoothing of the graphs in different ways. I started with a simple moving average filter, but it does not work. Introduces an undesirable delay.
Then I tried the Gaussian filter, but it does not fit what greatly distorts the values at the beginning and at the end of the data set, which is important for the correct display of periods of constant work Laptop. Otherwise, the beginning and end of the glued sessions get an artificial gap.

As a result, I invented the bike and made a filter based on the evaluation of the derivative and the change in the sampling frequency (first a decrease, then an increase). A controversial moment. I think the fans of digital signal processing throw me stones, in general, I’m open to discussion.


Time Calculation Up to a full charge / discharge is realized through linear extrapolation along the tangent. The most simple solution to get started.

Since I did not want to add external dependencies, I wrote my own SVG image generator.
Automatic color theme detection It did not work, so just added the switch to the drop-down menu.
This is, in general, everything.
→ Link to GitHub


